It still surprises me to see how many gamers flock to UserBenchmark to compare different models. Even those who understand that the stats are inaccurate still believe that they can rely on them for some estimations, such as Nvidia vs. Nvidia comparisons (which we’ll cover here as well) or the percentages given to different hardware.
Any random text on the UserBenchmark site, especially regarding performance and figures, is very likely to be inaccurate. Any data from the cpu.userbenchmark.com (we don’t even link to the site here) and to a large extent from the gpu.userbenchmark.com website is grossly and insultingly inaccurate and plainly false.
Never use this tool to make any decision. The rest of this article will just be a bashing and explanation of the why behind this advice.
Disclaimer: I have nothing against Nvidia or Intel. I’m only talking in favor of the gamer who browses the internet to look up performance figures and might get misled. Such a platform should not just be ignored. It should be pointed out for its inaccuracies and allowed to improve, as the underlying mechanism is theoretically beneficial for any gamer looking to build a PC. Additionally, not everything said on UserBenchmark is a gross lie. Some are minor lies, some are clever cover-ups, and some are actually true. The ratio of the actually-true to everything else is meager, however, as far as I could see.
- Anti-AMD stance
- Meet CPUPro: The deliverer of Intel-ligent justice, the harbinger of doom for AMD’s sales hype
- EFPS: The magic number of convenience
- What about Intel vs. Intel or Nvidia vs. Nvidia?
- What about the percentages given to the hardware? They seem pretty realistic
- User ratings
- But wait, what do I use to get my stats?
In the 4 screenshots below, you can see UserBenchmark being bashed by the PC hardware community on Twitter (including by GamersNexus) and it being banned from the r/Hardware and r/Intel subreddits. Apart from this, it’s also not allowed to post UserBenchmark screenshots or figures on a number of other PC building and gaming communities.
Video coverage
2kliksphilip has done excellent coverage on UserBenchmark through 2 videos, both a year apart, to call out the absolute crap standards of this “brave team of scientists.”
Anti-AMD stance
Many comparisons between AMD and Intel or AMD and Nvidia will have a detailed summary of the Intel or Nvidia product. For the AMD product, they will have descriptions of AMD’s marketing, sales hype, prices, and how they are bad. This is a common trend. Nobody, at least the people writing these summaries (read the section on CPUPro – the writer who we all should fear), have tested these products, yet they compare them to other products.
More than that, they deliberately make the AMD products sound bad in every comparison. Note that I did not say “almost every comparison.” They make AMD sound horrible in every single comparison, including some with decades-old hardware, which makes no sense. I’ll cover such instances more in the next sections specifically.
Enter Ryzen 3000
AMD processors were nothing but a speck before the release of Ryzen. Ryzen 1 offered more cores/threads vs. Intel with the Ryzen series and better multi-core performance as a result. Up until that point, Ryzen was still a small player.
Fast forward to the release of Ryzen’s third generation (3000) where it beat Intel in single-core as well. To compensate, UserBenchmark increased the weightage given to the single-core performance suddenly from 30% to 40% in the final rating and dropped that of quad-core performance a few percentage points.
That makes no sense.
The world was moving toward more and more cores, so why was single-core performance prioritized more than multi-core performance all of a sudden if not to stop AMD from totally crushing their own stats?
As a result of this, any +X% you see on AMD products is only a fraction of the actual performance improvement over the Intel counterpart in your comparison.
Heavy bias
UserBenchmark is heavily biased toward Nvidia cards and Intel processors. Any comparison between an Nvidia card and a similarly capable AMD card will show that the Nvidia card wins in some pretty dramatic way, more often than not.
In case there is absolutely no way that an AMD product can be inferior to a particular Intel or Nvidia product (imagine a new, powerful CPU vs. an old Intel processor), then the AMD product will definitely be shown better and faster, but by such a small factor that you’d think AMD is doing no innovation at all.
The “users” of UserBenchmark
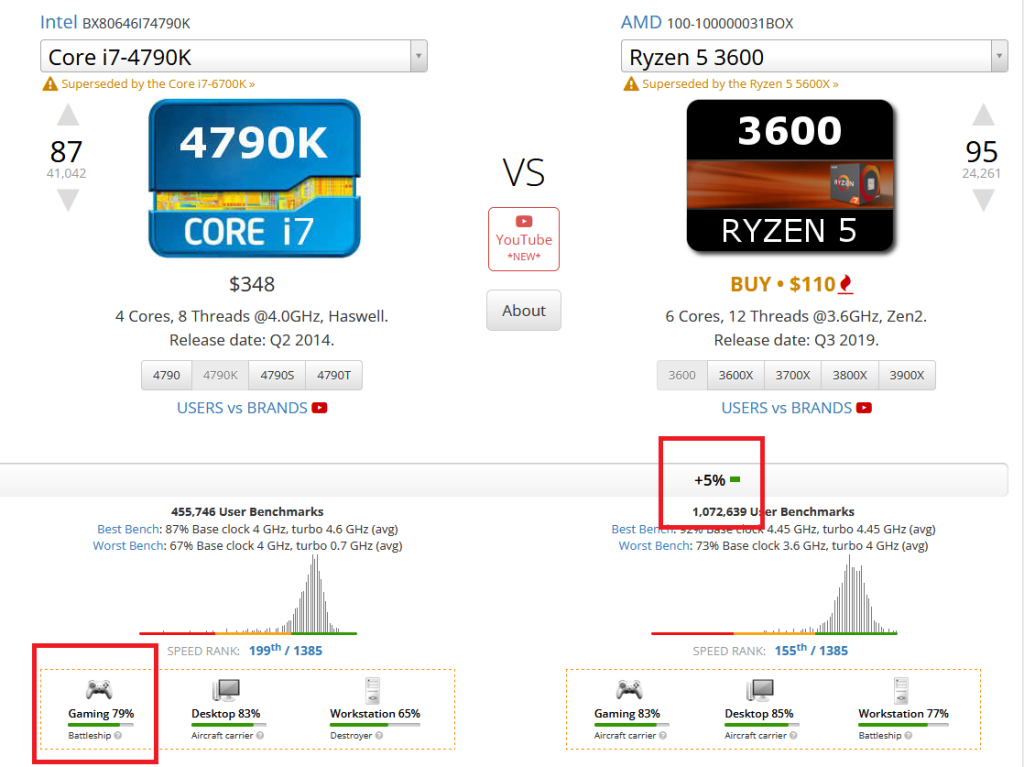
Do you really want me to believe that a Ryzen 5 3600 is only 5% faster than an Intel Core i7-4790K from 2014? And that a machine with the i7-4790K will be rated 79% for gaming when one with a Ryzen 5 3600 is only 4% better at 83% on whatever made-up rating scale this is?
Even tripping on acid, Intel itself will not come up with this shit (hence why the r/Intel subreddit itself doesn’t allow UserBenchmark ratings). But somehow user benchmarks from over 1.5 million actual gamers have realistically rated this comparison so? Are 90% of these users from the UserBenchmark’s basement team?
You’re free to read the comparison further to understand the level of bias. I’ve copied it here:
Warning: Inaccurate information and a deliberate attempt to even downplay the advantages of the AMD 5 3600 vs. the Intel Core i5-9600K follow.
“AMD continues to push the multi-core performance envelope: benchmarks show that the 3600 has a 27% overclocked 64-core lead over the 9600K but that the i5-9600K leads by 14% on single to hex core workloads which translates to 10% higher EFps in most of the today’s top games (e.g. PUBG, GTAV and CSGO). Additionally, the 3600’s memory controller, although significantly improved over previous Ryzen iterations, still has limited bandwidth and high latency which adversely impacts gaming. Weaknesses in memory architecture are not readily picked up by CPU benchmarks but they are apparent whilst gaming. Cheaper CPUs such as the 9400F deliver better gaming performance in nearly all of today’s popular games. At $190 USD, the 3600 offers good value for purely workstation tasks such as film production but streamers should look elsewhere. Streaming with dedicated hardware such as NVENC or a separate stream PC will nearly always result in fewer dropped frames. The masterfully hyped Ryzen 3600 may well be the best CPU for multimedia producers on a tight budget but in today’s market there are faster and less expensive alternatives for gamers, streamers and general desktop users.”

Meet CPUPro: The deliverer of Intel-ligent justice, the harbinger of doom for AMD’s sales hype
Lo and behold, the mighty wielder of the supreme power, CPUPro. CPUPro is the user profile that writes these snippets on CPUs, GPUs, and their comparisons. This is probably not a staff account and actually a single guy, but I’m not sure. The above passage about the Ryzen 5 3600 that makes no sense is also penned by the honorable CPUPro.
UserBenchmark has many users, and the URL of these accounts is as simple as /CPUPro or /GPUPro and then /User?id=n where n is a number. Some numbers are deleted accounts. The number 8 is special, as that’s the CPUPro’s main reviewing account (if the utter garbage they create can be termed review for any meaning of the word, that is).
If you take a walk through this account, you will see countless reviews (in fact, there are a good 238 ratings – though not all of them are reviews) praising, endlessly, every single Intel processor. The account has also rated many AMD processors (or “liked,” whatever that means) but many of them are lacking any opinion.
Some gems worth reading here (warning: take all of these snippets with a bucket of salt):
Consumers Have Little Interest in Radeon
“Following a series of overhyped releases, consumers have little interest in the Radeon brand. The combined market share for all of AMD’s (discrete) Radeon RX 5000 and 6000 GPUs (Jun ’22 Steam stats) is just 2%.”
Written on the Ryzen 7900X page and others.
I looked up the June 19 snapshot of the Steam Hardware Survey on the Wayback Machine as Steam doesn’t have a repository of all previous surveys (though it can be queried via a simple Python command). The share of AMD cards in general was less than 15%.
- One year is not sufficient data (the RX 6000 series was released in March 2021), especially when you’re not directly comparing it to an Nvidia product line and just using this as armor to strengthen a generic argument against AMD.
- As per the Steam Hardware Survey of January 2023, AMD has increased its share to 15.31% amid a global reduction in consumer GPU demand. Now, how much of this is made up of RX 5000 or 6000 series cards is not something I’d calculate, because Nvidia sits at the top for a reason – they have been here for longer, with truly superior hardware. The first-mover advantage aside, Nvidia cards are more popular and well-known because they have done the work (better supply chain, more partners, more market cap, more resale value, more third-party accessories, more game tie-ups, and so on). There’s no need to bash AMD for not being there sooner or not being the favorite if you can’t respect them for competing against an industry monopoly.
13400F vs. 7600X
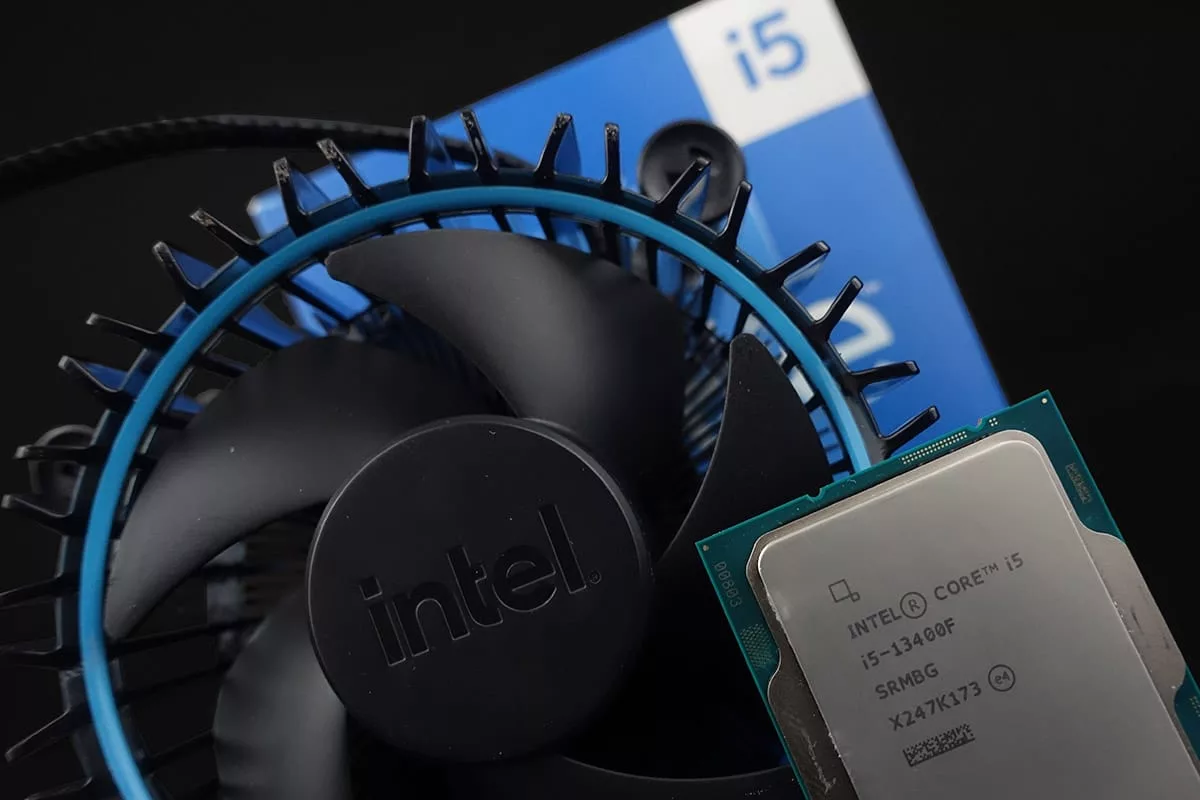
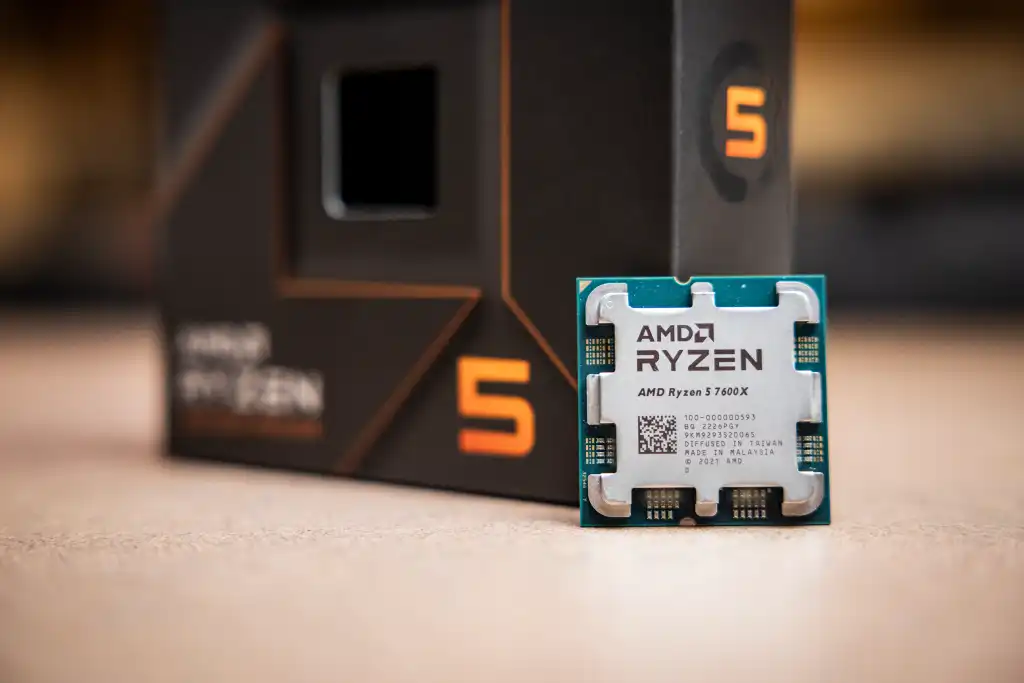
“The 13400F offers comparable gaming and better multi-core performance than AMD’s 7600X but at a lower price and without the need for an aftermarket cooler, DDR5 memory and an expensive motherboard.”
Written on the Intel i5 13400F vs. Ryzen 7600X comparison and others.
Yes, the 13400F has higher multi-core performance which is 8% higher in Cinebench R23. But the 5nm 7600X has 9% higher single-core performance, more power efficiency, unlocked multiplier (is overclockable, which means it can be more powerful in multi-core as well), more L3 cache, 700 MHz higher pure turbo frequency, and integrated graphics. The 10nm Intel i5-13400F does not have integrated graphics.
To quote a Robert Frost poem:
By which standard is CPUPro recommending processors and doling out judgment,
one might ask,
if one didn’t already know of,
the deep-ingrained bias.
AMD Sales Hype Machine
“Within minutes of the first, pre-release, 7000 series result appearing on userbenchmark, AMD’s advanced marketers declared a 20% win over the 12900K whilst simultaneously slandering userbenchmark via hundreds of “news” outlets and thousands of supposedly disinterested twitter, reddit, forum and youtube accounts. Buying new AMD products is like buying used cars: it takes time, experience and a taste for sales hype.”
Written on the Ryzen 9 7950X page and others.
Apart from the sheer audacity of this person to publish without basic proofreading, I also commend the sheer lack of basic compassion for fellow gamers. In their own hatred, they have made UserBenchmark reviews a place to continually only see the bad in AMD, invent new wrongdoings on the company’s part, and basically whine about a bunch of unrelated anti-AMD stuff for some reason beyond the comprehension of us common folk. The one who ends up paying dearly for this child’s whining is the unsuspecting gamer.
AMD Marketing Coverage
“Since Intel don’t care for long term relationships with PC hardware influencers, for product launches, they often end up sponsoring influencers that are mostly funded by AMD. As a result, Intel rarely get positive marketing coverage beyond launch, and their products remain relatively under priced compared to AMD.”
Written in many recent Intel “reviews” including the Core i3-13100F and others.
This is so wrong on so many levels that even calling it a blatant lie or gross misinformation will not suffice. Honestly, I’d love to go on dissecting the mighty words of CPUPro but I’m going to hope that these 4 pieces of reviews are sufficient.
EFPS: The magic number of convenience
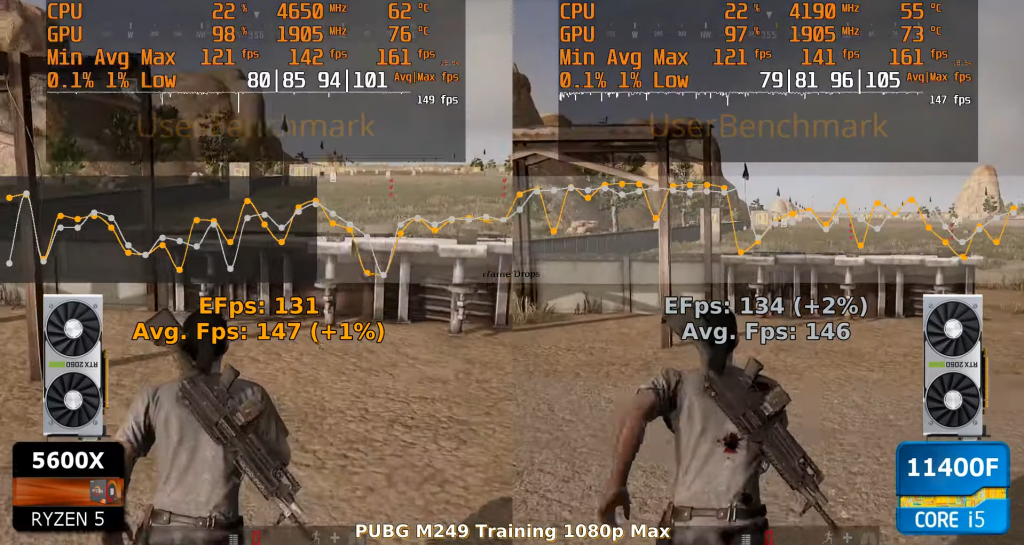
The blasphemy is far from over. The platform has cooked up this metric called EFPS or effective FPS which they proudly stylize as EFps. EFps theoretically takes stability (the lack of frame drops, which might happen due to bottlenecks) into account. How does it work? What do they use to determine this? Let’s ask CPUPro, maybe, but they only open their stupid mouth to talk about all that’s pathetic and wrong with AMD.
They have an FAQ page that talks about this metric in 4 paragraphs, one of them having actual numbers.
The 5th paragraph here is again, unsurprisingly, a bashing of AMD. On a page where they are talking about something totally different:
“PC components are similar to links in a chain: weak components bottleneck the whole system. For example: an AMD Ryzen 3700X bottlenecks an Nvidia 2070 Super. The 3700X costs 40% more money for 11% less performance. The lost performance is similar to downgrading from a 2070S to a 2060S. Publishing EFps data puts UserBenchmark in conflict with the marketers that represent billion dollar corporations, but it also helps users dodge marketing traps and build faster PCs.”
According to UserBenchmark, AMD has more money than Nvidia and Intel to steer public opinion with marketing. They also pay all tech reviewers a lot to have them sing the praises of AMD.
What about Intel vs. Intel or Nvidia vs. Nvidia?
I have seen i3s of the same generation being ranked higher than i9s. They cleaned up the website around 1-2 years ago, maybe, and now the results are more in line when doing Nvidia-Nvidia and Intel-Intel comparisons.
But what truly drives a dishonest person or team cannot be fully ascertained. The platform might be trying to sell you what you don’t need, even in same-brand comparisons.
Years of using outdated or strangely designed testing means that the stats reported are inaccurate and can’t be used to build a better PC. The additional tinkering to favor Intel or Nvidia performance vis-à-vis AMD hasn’t made the Intel or Nvidia figures any more accurate.

Processors
Imagine some Ryzen processors being generally compared with certain mid-tier Intel processors. To bump up these mid-tier Intel CPUs, UserBenchmark has tinkered with its algorithm and tweaked the numbers a lot. This has actually resulted in them reporting mid-tier Intel CPUs higher than the top-tier CPUs of the same Intel product family.
Learning from this quickly, they now tinker differently within each bracket so that in each bracket, the difference between Intel and AMD products is as in favor of Intel as possible. Because of the different rating mechanisms in different product brackets, all the ratings are nonsensical and very likely far from the truth.
For example, power is given more attention in lower-end CPUs to disadvantage a Ryzen CPU and it’s not considered very important in higher-end CPUs because there, Intel lacks, and instead, more focus is given to single-core performance. They choose which metrics will harm AMD the most and/or help Intel the most for each price point or product bracket.
They also want you to buy a new generation, or maybe there is some other error or agenda here.
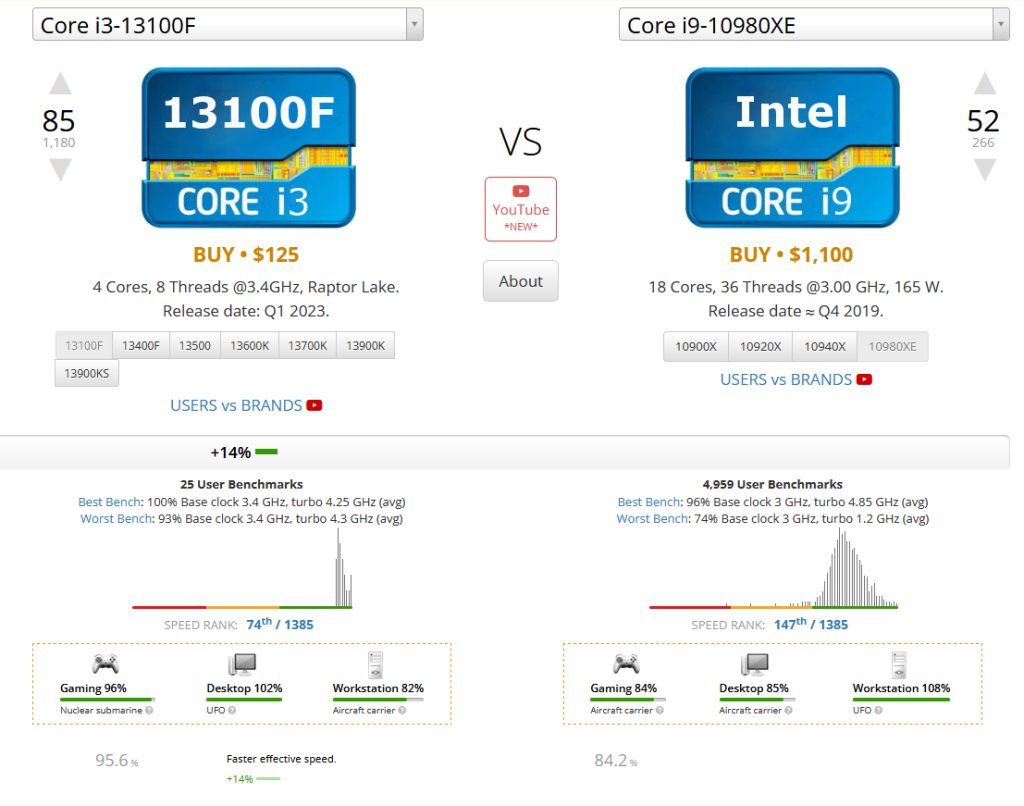
According to UserBenchmark’s magic ratings, The 4-core Core i3-13100F is 14% faster than the 18-core Core i9-10980XE (that’s the Extreme Edition). In gaming, it’s 12% better.
This is the equivalent of comparing a dude with 20 IQ with Magnus Carlsen in chess when the dude is mentally challenged. I’d say “comparing CPUPro to Carlsen” if CPUPro had IQ in double digits to start with.
Graphics cards
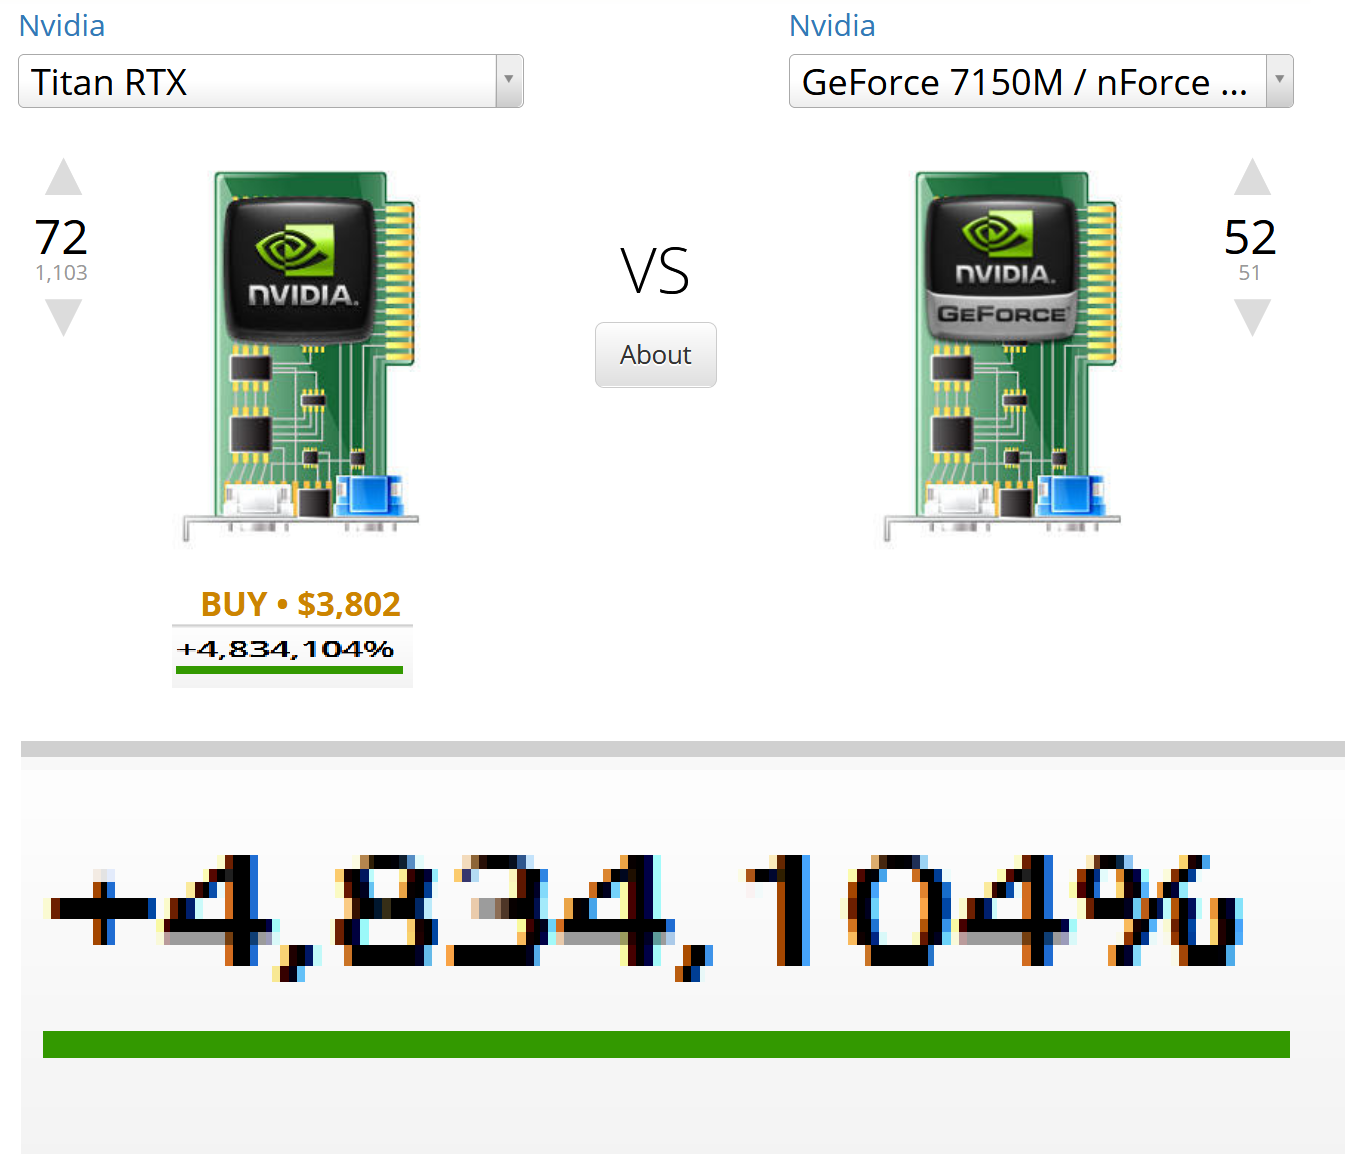
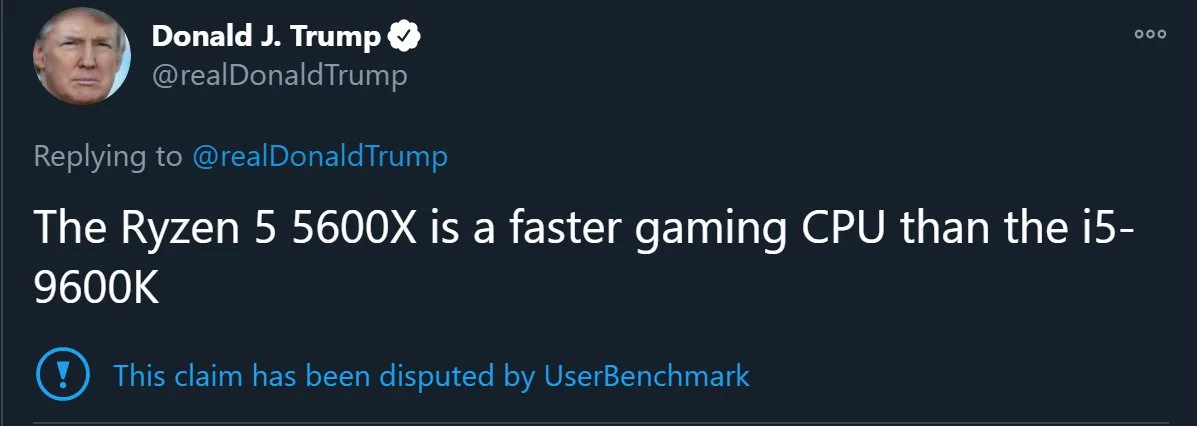
There are also traces of bogus reporting in GPUs. This is likely because they don’t have sufficient data and mistakes will happen. For Nvidia GPUs, they have often incorrect reports because of the inherent tinkering of whatever algorithms are used. The advantage or disadvantage of an Nvidia GPU over another Nvidia GPU can, therefore, be smaller or bigger than it actually is.
What about the percentages given to the hardware? They seem pretty realistic


The only thing that’s a little realistic is the percentages given to all the Nvidia GPUs relative to themselves. For example, the RTX 3070 Ti is 158% but the RTX 3080 is 187%. Clearly, the RTX 3080 is better than the RTX 3070 Ti, so if a gamer was choosing between these two, they’d be in the clear.
But now compare it to a different card. The AMD RX 6800 XT, let’s say.
Quick heads up: Apart from having 8GB more VRAM, the RX 6800 XT is vastly superior to the RTX 3070 Ti and can give anywhere from 15% to 20% more FPS with better thermals. The 6800 XT has a higher base and boost clock speed, more memory clock speed, more ray tracing cores, etc. while having a 300W TDP whereas the 3070 Ti is 290W. All in all, these are two different products and not comparable, as the RX 6800 XT competes with the RTX 3080, which is significantly better than the RTX 3070 Ti. So, technically, RX 6800 XT = RTX 3080 < RTX 3070 Ti. But nope, according to UserBenchmark, it’s RTX 3080 < RTX 3070 Ti < RX 6800 XT, which is nonsensical even according to their own percentages.
Let’s check this comparison on UserBenchmark. RX 6800 XT is rated 171% which is only slightly better. It’s actually “user rated” below the 3070 Ti (64 vs. 58). The “value and sentiment” for the RTX 3070 Ti is +224%!
The effective speed of the AMD RX 6800XT is only 8% more than the RTX 3070 Ti. This profound joke is further accentuated by the closing remark by GPUPro, the sister account to CPUPro:
Users should be wary of AMD’s army of social media accounts, they aim to dupe shoppers any way they can.
User ratings
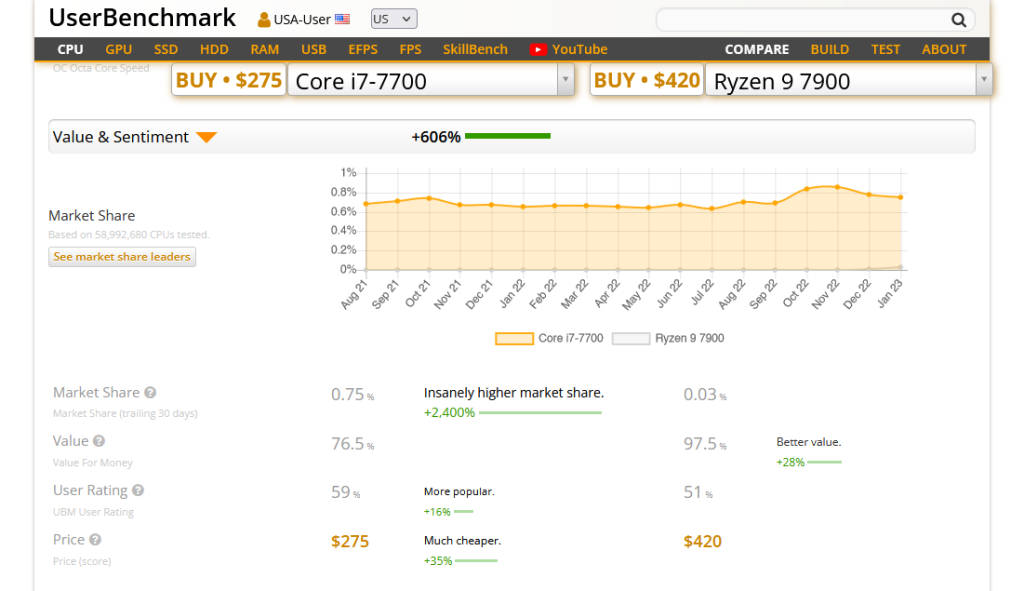
Are user ratings useful if they give the potential buyer a wrong representation of practical facts? The 6-year-old Core i7-7700 ranks 59 vs. the AMD Ryzen 9 7900 which is at 51. A great part of this has to be the +606% that the i7-7700 has in the “Value & Sentiment” department, with an “insanely higher market share.”
I kid you not, you take all PC users into account and the market share of Pentium users will also be insanely higher compared to a processor released in Q2, 2023 that’s still quite affordable. Should that guide a gamer building a PC? I sure hope not.
The i7-7700 is 35% cheaper than the Ryzen 9 7900. And this is somehow factored in? If a 4-core processor capped at 3.6GHz from 2017 is not 35% cheaper than an overclockable 12-core that can go up to 5.4GHz 6 years later, then what are companies even doing?
That does not mean that your review should take that into its scoring and recommend it with a higher user rating.
When comparing an AMD chip that’s clearly superior to an Intel one, the review mentions other stuff to sort of still drive the uninitiated gamer toward a worse Intel chip. For example, if you compare a Core i3-13100 with a Ryzen 5 5600X, you will actually see:
- i3-13100 is rated “+0% better” in effective speed than the Ryzen 5 5600X.
- Both processors are 96% rated for gaming, but the i3-13100 is rated 3% better for desktop use and 4% better for workstation usage.
- The i3-13100 has a +2% average score.
- The average benchmark for the i3-13100 is 96.3% vs. the R5 5600X’s 95.9%. They actually mean to say that the 5600X is worse.
To cap it all off, there’s this passage in their “review”:
“Now that AMD have actually achieved both top tier performance and market share, their marketing machinery is focused on price hikes. Users that do not wish to pay a marketing premium should investigate Intel’s 11400F, which, when paired with a 2060 Super, delivers higher EFps in four out of five of today’s most popular games, at half the price. Allocating the savings to a higher tier GPU will result in a far superior gaming PC.”
On Amazon, the Intel i5-11400F costs $134 and the Ryzen 5 5600X costs $166. I don’t know about CPUPro’s math skills, but the $32 more is actually justified and between these two processors specifically, you’re actually better off buying the Ryzen 5 5600X more often than not. But in yet another attempt to mislead people, CPUPro would tell you otherwise and have you buy a more expensive graphics card as well.
Wrapping up

The unnecessary bashing of AMD and the talk about the imaginary media hype or conspiracy surrounding AMD is just not funny anymore. The fact that nobody from tech reviewers to subreddits seriously mentions the service is reason enough for you to not trust this website.
On the surface, it’s a nifty little tool. The process is simple. You download a piece of software and run it on your PC. It then benchmarks your CPU or GPU (they also have SSD, HDD, and RAM benchmarks against I’m not sure which brand) by running tests including (for the GPU) six 3D game simulations. It’s just that they have too much of an anti-AMD mindset and hand-designed tests to give Intel more points among other malicious practices that ultimately harm gamers.
I will not be surprised if they literally have a single guy sitting there writing these specs and figures without any substantial “user” backing or ratings.
And this whining crybaby is hell-bent on ridiculing AMD’s apparently substandard products overhyped by marketing and media, which AMD pays for–A company the lead reviewer for a fact “knows” that is making gamers sick constantly, and gamers are leaving this company. It makes one wonder where is AMD getting all this money from with such an ever-decreasing market supply to fund all these anti-Intel and anti-Nvidia marketing campaigns.
But wait, what do I use to get my stats?
So, what should you use for the right information? Here are some great ways to get accurate, near-accurate (as you might not have the same test kit), or at the very least, reliable performance specs and figures.
YouTube reviewers
If you’re looking for a recent GPU or CPU’s performance and benchmarks, such as in-game FPS, you should always first search on YouTube. There are many excellent content creators and hardware reviewers on YouTube who have been benchmarking hardware for years and have the right tools as well as a conscience to truly help gamers.
These include GamersNexus, LinusTechTips or LTT, Paul’s Hardware, Hardware Unboxed, JayzTwoCents, IGN, etc. Putting all these channels in the same category is a little difficult as all of them have different priorities, different setups, and different audiences. But any of these channels is a good starting point, and you should ideally watch multiple perspectives especially if you’re about to spend big bucks on gaming hardware or any kind of gaming PC parts like a high-end GPU or processor.
When in doubt, go to Reddit
Small questions can be Googled. Basic troubleshooting can even be done on ChatGPT now. However, more specific questions can be asked on Reddit. Reddit is a great place but if your query is shallow, lacks initial research, or is off in some way, you might receive no help at all. It’s always better to ask well-articulated and priorly researched questions.
Note that most of the PC or gaming-related subreddits don’t take UserBenchmark ratings seriously and some even have rules against posting UserBenchmark ratings, so don’t even try to mention UserBenchmark in any of these communities. For example, r/Intel and r/Nvidia have banned any UserBenchmark rating submission and r/PCMasterRace has a bot that gives a warning whenever someone links to that domain.
Subreddits you can ask questions on:
- r/buildapc – “Planning on building a computer but need some advice? This is the place to ask! A community-driven subreddit dedicated to custom PC assembly.” Next to a PC specialist, this subreddit is by far the most reliable and popular source of PC-building help ever.
- r/pcmasterrace – “All PC related content is welcome, including build help, tech support, and any doubt one might have about PC ownership.”
- r/pcgaming – “PC gaming news and discussion.”
- r/pchelp – “For PC questions/assistance.”
- r/techsupport – “Stumped on a Tech problem? Ask the tech support reddit, and try to help others with their problems as well.”
- r/overclocking – “All things overclocking go here. Learn to overclock, ask experienced users your questions, boast your rock-stable, sky-high OC and help others!”
- r/gaminglaptops – Gaming laptop discussions.
- r/gamingpc – “All about gaming hardware for the PC: Custom build pictures, Hardware Reviews, Hardware Discussion, Hardware Benchmarks, Guides, Internal hardware, and gaming peripherals from mainboards to mice.”
- r/pcbuild – “This is a sub for Pc-Building enthusiasts, where you can get and give help about anything! (Questions, Budgets, etc.)”
- r/gaming – Everything about games.
- There are also game-specific subreddits (like r/Doom or r/Witcher), brand-specific subreddits (like r/Nvidia or r/MSILaptops), and product line specific subreddits (like r/AcerNitro or r/LenovoLegion).
Known review websites
Significantly more accurate results can be found on many websites that dedicate their time and energy to writing detailed reviews.
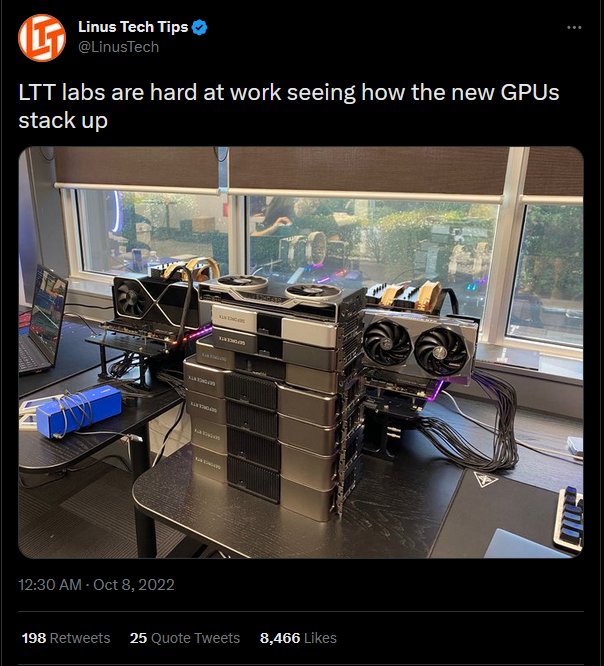
Ideally, you want to read or watch a review of a part. If you wish to compare it and it’s not listed in the same table/chart on that article or video, you ideally want a different one that has it from the same source and with the same rig. However, this is not always possible, though LTT is working on a centralized database as such through LTT Labs. It can take a while before it completely materializes, however.
Here are some excellent options:
- TechPowerUp reviews are always reliable. You can even check hardware by game benchmarks for a particular game. Their average FPS counter is more accurate than anything else.
- Tom’s Hardware has GPU tier charts which are infinitely more useful than the GPU vs. GPU or CPU vs. CPU comparison of UserBenchmark.
- 3DMark and PCMark are good tools to benchmark hardware, and there are ways to look up the benchmark information collected from these tests, which is extremely beneficial when comparing two close GPUs or CPUs.
- Technical.city is also a great way to compare different hardware. I haven’t used it a lot personally but many recommend it for unbiased benchmarks.



Great article! It was really enjoyable to read and will be a great help to newer pc builders, particularly the resources list with explainers at the end.
I used to compare products on UserBenchmark because it was easy. I was often taken aback by their strong and direct negative comments about AMD at the bottom end of their reviews. I was recently told that UserBenchmark may be biased against AMD, but I still took that with a grain of salt. Having looked up and read numerous articles about ‘whether UserBenchmark is biased’ on many websites, I am so pleased that I took the time to do just that. My eyes have been opened. It is simply amazing how easily UserBenchmark has been able to massively skew results and comments, and still remain relevant to the casual user, like me, until now. I never put all my faith into any single review anyway, but I am utterly disgusted with UserBenchmark now.
Thank you for the article.